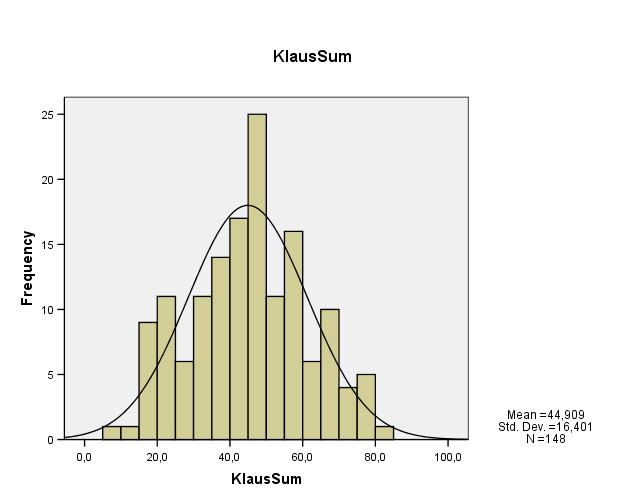
Gesamt-
verteilung
beider
Klausuren
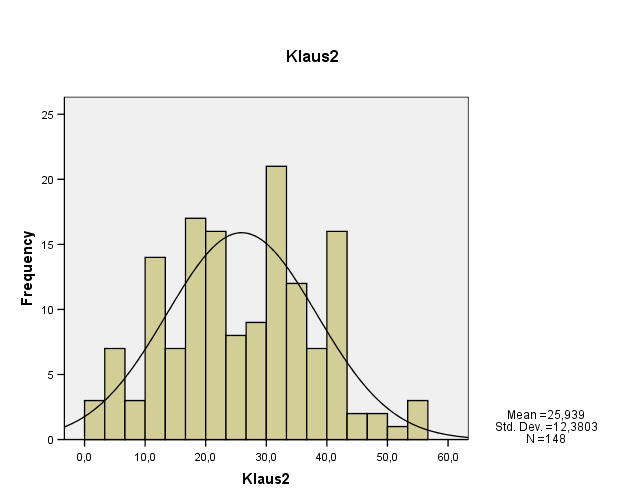
Verteilung
Klausur 2
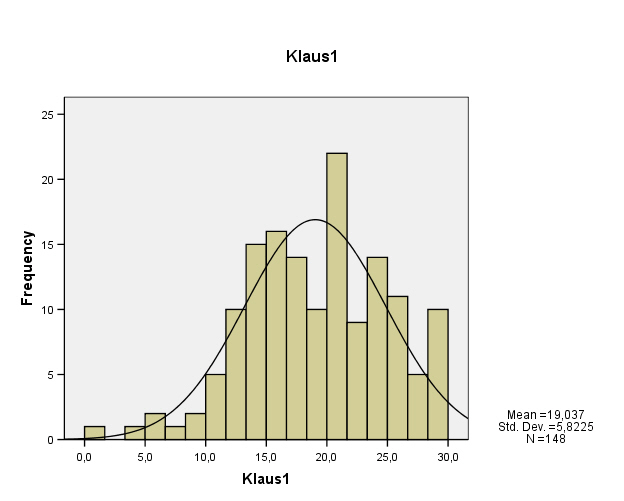
Verteilung
Klausur 1
Gesamt-
|
|
|
Verteilung |
|
|
Verteilung
|
|
| "bestanden" ab 45 Punkten |
Punkte |
Klaus1 | Klaus2 | KlausSum |
|---|---|---|---|---|
| N | Valid | 148 | 148 | 148 |
| Missing | 0 | 0 | 0 | |
| Mean | 19,037 | 25,939 | 44,909 | |
| Std. Error of Mean | ,4786 | 1,0177 | 1,3482 | |
| Median | 19,000 | 26,000 | 45,000 | |
| Mode | 16,0(a) | 19,0(a) | 49,0 | |
| Std. Deviation | 5,8225 | 12,3803 | 16,4010 | |
| Variance | 33,902 | 153,272 | 268,993 | |
| Kurtosis | ,048 | -,708 | -,523 | |
| Std. Error of Kurtosis | ,396 | ,396 | ,396 | |
| Range | 30,0 | 53,0 | 79,0 | |
| Minimum | ,0 | 1,0 | 5,0 | |
| Maximum | 30,0 | 54,0 | 84,0 | |
| Sum | 2817,5 | 3839,0 | 6646,5 | |
| Percentiles | 10 | 12,000 | 10,000 | 21,950 |
| 20 | 14,000 | 14,800 | 30,000 | |
| 25 | 14,750 | 17,000 | 33,000 | |
| 30 | 16,000 | 19,000 | 36,500 | |
| 40 | 17,800 | 21,000 | 41,300 | |
| 50 | 19,000 | 26,000 | 45,000 | |
| 60 | 21,000 | 30,000 | 49,000 | |
| 70 | 22,000 | 33,000 | 54,000 | |
| 75 | 24,000 | 35,000 | 56,000 | |
| 80 | 24,000 | 38,000 | 58,100 | |
| 90 | 27,000 | 42,100 | 67,550 | |
| a Multiple modes exist. The smallest value is shown | ||||
|
Punkte |
Frequency | Percent | Valid Percent | Cumulative Percent |
|---|---|---|---|---|---|
|
:(
|
5,0 | 1 | ,7 | ,7 | ,7 |
| 13,0 | 1 | ,7 | ,7 | 1,4 | |
| 15,5 | 1 | ,7 | ,7 | 2,0 | |
| 16,5 | 1 | ,7 | ,7 | 2,7 | |
| 17,0 | 2 | 1,4 | 1,4 | 4,1 | |
| 17,5 | 1 | ,7 | ,7 | 4,7 | |
| 18,0 | 1 | ,7 | ,7 | 5,4 | |
| 19,0 | 2 | 1,4 | 1,4 | 6,8 | |
| 19,5 | 1 | ,7 | ,7 | 7,4 | |
| 21,0 | 2 | 1,4 | 1,4 | 8,8 | |
| 21,5 | 1 | ,7 | ,7 | 9,5 | |
| 22,0 | 3 | 2,0 | 2,0 | 11,5 | |
| 24,0 | 3 | 2,0 | 2,0 | 13,5 | |
| 24,5 | 2 | 1,4 | 1,4 | 14,9 | |
| 25,0 | 1 | ,7 | ,7 | 15,5 | |
| 25,5 | 1 | ,7 | ,7 | 16,2 | |
| 26,0 | 1 | ,7 | ,7 | 16,9 | |
| 27,5 | 1 | ,7 | ,7 | 17,6 | |
| 28,0 | 1 | ,7 | ,7 | 18,2 | |
| 28,5 | 1 | ,7 | ,7 | 18,9 | |
| 30,0 | 3 | 2,0 | 2,0 | 20,9 | |
| 30,5 | 2 | 1,4 | 1,4 | 22,3 | |
| 31,0 | 1 | ,7 | ,7 | 23,0 | |
| 31,5 | 1 | ,7 | ,7 | 23,6 | |
| 32,0 | 1 | ,7 | ,7 | 24,3 | |
| 33,0 | 2 | 1,4 | 1,4 | 25,7 | |
| 33,5 | 1 | ,7 | ,7 | 26,4 | |
| 35,0 | 2 | 1,4 | 1,4 | 27,7 | |
| 36,0 | 2 | 1,4 | 1,4 | 29,1 | |
| 36,5 | 2 | 1,4 | 1,4 | 30,4 | |
| 37,0 | 2 | 1,4 | 1,4 | 31,8 | |
| 37,5 | 2 | 1,4 | 1,4 | 33,1 | |
| 38,0 | 2 | 1,4 | 1,4 | 34,5 | |
| 39,0 | 1 | ,7 | ,7 | 35,1 | |
| 39,5 | 1 | ,7 | ,7 | 35,8 | |
| 40,0 | 5 | 3,4 | 3,4 | 39,2 | |
| 41,0 | 1 | ,7 | ,7 | 39,9 | |
| 41,5 | 1 | ,7 | ,7 | 40,5 | |
| 42,0 | 2 | 1,4 | 1,4 | 41,9 | |
| 43,0 | 3 | 2,0 | 2,0 | 43,9 | |
| 44,0 | 3 | 2,0 | 2,0 | 45,9 | |
| 44,5 | 2 | 1,4 | 1,4 | 47,3 | |
| 45,0 | 5 | 3,4 | 3,4 | 50,7 | |
| 46,5 | 2 | 1,4 | 1,4 | 52,0 | |
| 47,0 | 4 | 2,7 | 2,7 | 54,7 | |
| 47,5 | 1 | ,7 | ,7 | 55,4 | |
| 48,0 | 2 | 1,4 | 1,4 | 56,8 | |
| 48,5 | 1 | ,7 | ,7 | 57,4 | |
| 49,0 | 9 | 6,1 | 6,1 | 63,5 | |
| 49,5 | 1 | ,7 | ,7 | 64,2 | |
| 50,0 | 2 | 1,4 | 1,4 | 65,5 | |
| 51,0 | 3 | 2,0 | 2,0 | 67,6 | |
| 52,0 | 2 | 1,4 | 1,4 | 68,9 | |
| 53,0 | 1 | ,7 | ,7 | 69,6 | |
| 54,0 | 3 | 2,0 | 2,0 | 71,6 | |
| 55,0 | 4 | 2,7 | 2,7 | 74,3 | |
| 56,0 | 2 | 1,4 | 1,4 | 75,7 | |
| 57,0 | 1 | ,7 | ,7 | 76,4 | |
| 58,0 | 6 | 4,1 | 4,1 | 80,4 | |
| 58,5 | 1 | ,7 | ,7 | 81,1 | |
| 59,0 | 1 | ,7 | ,7 | 81,8 | |
| 59,5 | 1 | ,7 | ,7 | 82,4 | |
| 60,0 | 1 | ,7 | ,7 | 83,1 | |
| 60,5 | 1 | ,7 | ,7 | 83,8 | |
| 63,0 | 2 | 1,4 | 1,4 | 85,1 | |
| 63,5 | 1 | ,7 | ,7 | 85,8 | |
| 64,0 | 1 | ,7 | ,7 | 86,5 | |
| 66,0 | 2 | 1,4 | 1,4 | 87,8 | |
| 67,0 | 3 | 2,0 | 2,0 | 89,9 | |
| 67,5 | 1 | ,7 | ,7 | 90,5 | |
| 68,0 | 2 | 1,4 | 1,4 | 91,9 | |
| 69,0 | 2 | 1,4 | 1,4 | 93,2 | |
| 70,0 | 2 | 1,4 | 1,4 | 94,6 | |
| 72,0 | 2 | 1,4 | 1,4 | 95,9 | |
| 75,5 | 1 | ,7 | ,7 | 96,6 | |
| 77,0 | 1 | ,7 | ,7 | 97,3 | |
| 78,0 | 2 | 1,4 | 1,4 | 98,6 | |
| 79,0 | 1 | ,7 | ,7 | 99,3 | |
| 84,0 | 1 | ,7 | ,7 | 100,0 | |
| Total | 148 | 100,0 | 100,0 |
| Punkte |
Frequency | Percent | Valid Percent | Cumulative Percent | |
|---|---|---|---|---|---|
| Valid | 1,0 | 2 | 1,4 | 1,4 | 1,4 |
| 3,0 | 1 | ,7 | ,7 | 2,0 | |
| 4,0 | 2 | 1,4 | 1,4 | 3,4 | |
| 5,0 | 2 | 1,4 | 1,4 | 4,7 | |
| 6,0 | 3 | 2,0 | 2,0 | 6,8 | |
| 8,0 | 1 | ,7 | ,7 | 7,4 | |
| 9,0 | 2 | 1,4 | 1,4 | 8,8 | |
| 10,0 | 5 | 3,4 | 3,4 | 12,2 | |
| 11,0 | 4 | 2,7 | 2,7 | 14,9 | |
| 12,0 | 3 | 2,0 | 2,0 | 16,9 | |
| 13,0 | 2 | 1,4 | 1,4 | 18,2 | |
| 14,0 | 2 | 1,4 | 1,4 | 19,6 | |
| 15,0 | 3 | 2,0 | 2,0 | 21,6 | |
| 16,0 | 2 | 1,4 | 1,4 | 23,0 | |
| 17,0 | 6 | 4,1 | 4,1 | 27,0 | |
| 18,0 | 3 | 2,0 | 2,0 | 29,1 | |
| 19,0 | 8 | 5,4 | 5,4 | 34,5 | |
| 20,0 | 4 | 2,7 | 2,7 | 37,2 | |
| 21,0 | 6 | 4,1 | 4,1 | 41,2 | |
| 22,0 | 2 | 1,4 | 1,4 | 42,6 | |
| 23,0 | 4 | 2,7 | 2,7 | 45,3 | |
| 24,0 | 2 | 1,4 | 1,4 | 46,6 | |
| 24,5 | 1 | ,7 | ,7 | 47,3 | |
| 25,0 | 3 | 2,0 | 2,0 | 49,3 | |
| 26,0 | 2 | 1,4 | 1,4 | 50,7 | |
| 27,0 | 4 | 2,7 | 2,7 | 53,4 | |
| 27,5 | 1 | ,7 | ,7 | 54,1 | |
| 28,0 | 3 | 2,0 | 2,0 | 56,1 | |
| 29,0 | 1 | ,7 | ,7 | 56,8 | |
| 30,0 | 8 | 5,4 | 5,4 | 62,2 | |
| 31,0 | 5 | 3,4 | 3,4 | 65,5 | |
| 32,0 | 5 | 3,4 | 3,4 | 68,9 | |
| 33,0 | 3 | 2,0 | 2,0 | 70,9 | |
| 34,0 | 3 | 2,0 | 2,0 | 73,0 | |
| 35,0 | 6 | 4,1 | 4,1 | 77,0 | |
| 36,0 | 3 | 2,0 | 2,0 | 79,1 | |
| 37,0 | 1 | ,7 | ,7 | 79,7 | |
| 38,0 | 2 | 1,4 | 1,4 | 81,1 | |
| 39,0 | 4 | 2,7 | 2,7 | 83,8 | |
| 40,0 | 3 | 2,0 | 2,0 | 85,8 | |
| 42,0 | 7 | 4,7 | 4,7 | 90,5 | |
| 43,0 | 6 | 4,1 | 4,1 | 94,6 | |
| 45,0 | 1 | ,7 | ,7 | 95,3 | |
| 46,0 | 1 | ,7 | ,7 | 95,9 | |
| 47,0 | 1 | ,7 | ,7 | 96,6 | |
| 48,0 | 1 | ,7 | ,7 | 97,3 | |
| 50,0 | 1 | ,7 | ,7 | 98,0 | |
| 54,0 | 3 | 2,0 | 2,0 | 100,0 | |
| Total | 148 | 100,0 | 100,0 |
| Punkte |
Frequency | Percent | Valid Percent | Cumulative Percent | |
|---|---|---|---|---|---|
| Valid | ,0 | 1 | ,7 | ,7 | ,7 |
| 4,0 | 1 | ,7 | ,7 | 1,4 | |
| 5,0 | 1 | ,7 | ,7 | 2,0 | |
| 6,5 | 1 | ,7 | ,7 | 2,7 | |
| 8,0 | 1 | ,7 | ,7 | 3,4 | |
| 9,0 | 1 | ,7 | ,7 | 4,1 | |
| 9,5 | 1 | ,7 | ,7 | 4,7 | |
| 10,0 | 3 | 2,0 | 2,0 | 6,8 | |
| 11,5 | 2 | 1,4 | 1,4 | 8,1 | |
| 12,0 | 7 | 4,7 | 4,7 | 12,8 | |
| 12,5 | 2 | 1,4 | 1,4 | 14,2 | |
| 13,0 | 1 | ,7 | ,7 | 14,9 | |
| 13,5 | 4 | 2,7 | 2,7 | 17,6 | |
| 14,0 | 8 | 5,4 | 5,4 | 23,0 | |
| 14,5 | 3 | 2,0 | 2,0 | 25,0 | |
| 15,5 | 1 | ,7 | ,7 | 25,7 | |
| 16,0 | 12 | 8,1 | 8,1 | 33,8 | |
| 16,5 | 3 | 2,0 | 2,0 | 35,8 | |
| 17,0 | 4 | 2,7 | 2,7 | 38,5 | |
| 17,5 | 2 | 1,4 | 1,4 | 39,9 | |
| 18,0 | 8 | 5,4 | 5,4 | 45,3 | |
| 18,5 | 3 | 2,0 | 2,0 | 47,3 | |
| 19,0 | 6 | 4,1 | 4,1 | 51,4 | |
| 19,5 | 1 | ,7 | ,7 | 52,0 | |
| 20,0 | 6 | 4,1 | 4,1 | 56,1 | |
| 20,5 | 5 | 3,4 | 3,4 | 59,5 | |
| 21,0 | 10 | 6,8 | 6,8 | 66,2 | |
| 21,5 | 1 | ,7 | ,7 | 66,9 | |
| 22,0 | 7 | 4,7 | 4,7 | 71,6 | |
| 22,5 | 1 | ,7 | ,7 | 72,3 | |
| 23,0 | 1 | ,7 | ,7 | 73,0 | |
| 23,5 | 2 | 1,4 | 1,4 | 74,3 | |
| 24,0 | 12 | 8,1 | 8,1 | 82,4 | |
| 25,0 | 6 | 4,1 | 4,1 | 86,5 | |
| 26,0 | 4 | 2,7 | 2,7 | 89,2 | |
| 26,5 | 1 | ,7 | ,7 | 89,9 | |
| 27,0 | 4 | 2,7 | 2,7 | 92,6 | |
| 28,0 | 1 | ,7 | ,7 | 93,2 | |
| 28,5 | 2 | 1,4 | 1,4 | 94,6 | |
| 29,0 | 4 | 2,7 | 2,7 | 97,3 | |
| 30,0 | 4 | 2,7 | 2,7 | 100,0 | |
| Total | 148 | 100,0 | 100,0 |
| Output Created | 31-JAN-2006 20:04:23 | |
|---|---|---|
| Comments | ||
| Input | Data | D:\DATA\TEXT\!Medieninformatik\lineare Algebra Inf Bucholz -2005\klausurstatistik\MIBIK1K2.sav |
| Filter | <none> | |
| Weight | <none> | |
| Split File | <none> | |
| N of Rows in Working Data File | 148 | |
| Missing Value Handling | Definition of Missing | User-defined missing values are treated as missing. |
| Cases Used | Statistics are based on all cases with valid data. | |
| Syntax | FREQUENCIES VARIABLES=Klaus1 Klaus2 KlausSum /NTILES= 4 /NTILES= 10 /PERCENTILES= 10 20 30 40 50 60 70 80 90 /STATISTICS=STDDEV VARIANCE RANGE MINIMUM MAXIMUM SEMEAN MEAN MEDIAN MODE SUM KURTOSIS SEKURT /HISTOGRAM NORMAL /ORDER= ANALYSIS . |
|
| Resources | Elapsed Time | 0:00:09,23 |
| Total Values Allowed | 224841 | |